Ingenious comes with built in tracking for changes made on configuration data, which is, simply put, data that can be changed via the UI or through terminal commands.
Access to audit logs requires the Audit Changes permission.
Configuration data includes things like
- Stations
- Rails
- Orders
- Routes
- Articles
- System Settings
- etc
It does not include production data, such as carriers, operation history or routing data. Also some properties are excluded from tracking, such as the StartCount on OrderLine, as they are considered production data and would generate many unwanted audit entries.
To access the audit function, navigate to a page with configuration data, such as "Station Settings", then select a row and press one of these icons.
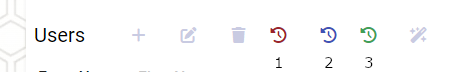
Button 1 - Audit changes on the selected item
Button 2 - Audit changes on all items, this includes deleted items also
Button 3 - Audit changes made by a specific user, this button is only available on the Users page.
Once you have clicked on one of the butttons, the audit window will pop up. Here you have the following options
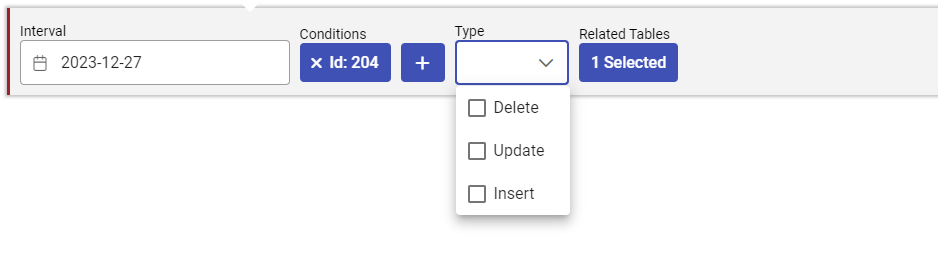
Interval - The date interval you want to search. Selecting a big interval can result in a very large number of changes, so try to be as specific as possible
Conditions - Can be used to limit the search to changes relating to a specific entity, such as a user or a station. This is filled in automatically when you use the red button.
Type - Filter on type of change. Can be useful to quickly find items that were deleted.
Related Tables - Select related tables for changes that were made while they had some kind of connection to the base item. For example, you can include the "Rail" table when viewing "Station Settings", and this will show changes on the Rail entities that are connected with the currently selected station, such as a change in rail load limit, or block/unblocking the rail. The related tables selection will not function if ArangoDb has not been installed on the server. This is the database that keeps track of temporal relations between all the different configuration entities.
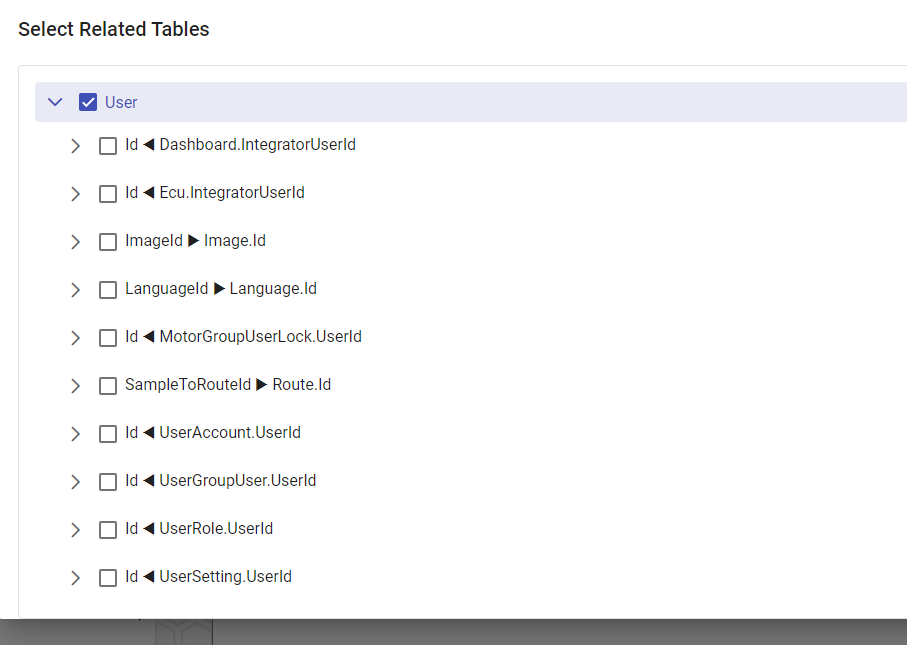
This picture shows all the relations that can be explored starting from a User. Each lines shows a navigation property and an incoming or outgoing relationship with a different table. You can expand each relation and find more distantly connected entities.
There is no need to select every parent node in the tree if you are only interested in the changes far down. Even the base node does not need to be selected.
In the listed changes, each row can be expanded to show the full information about the change.
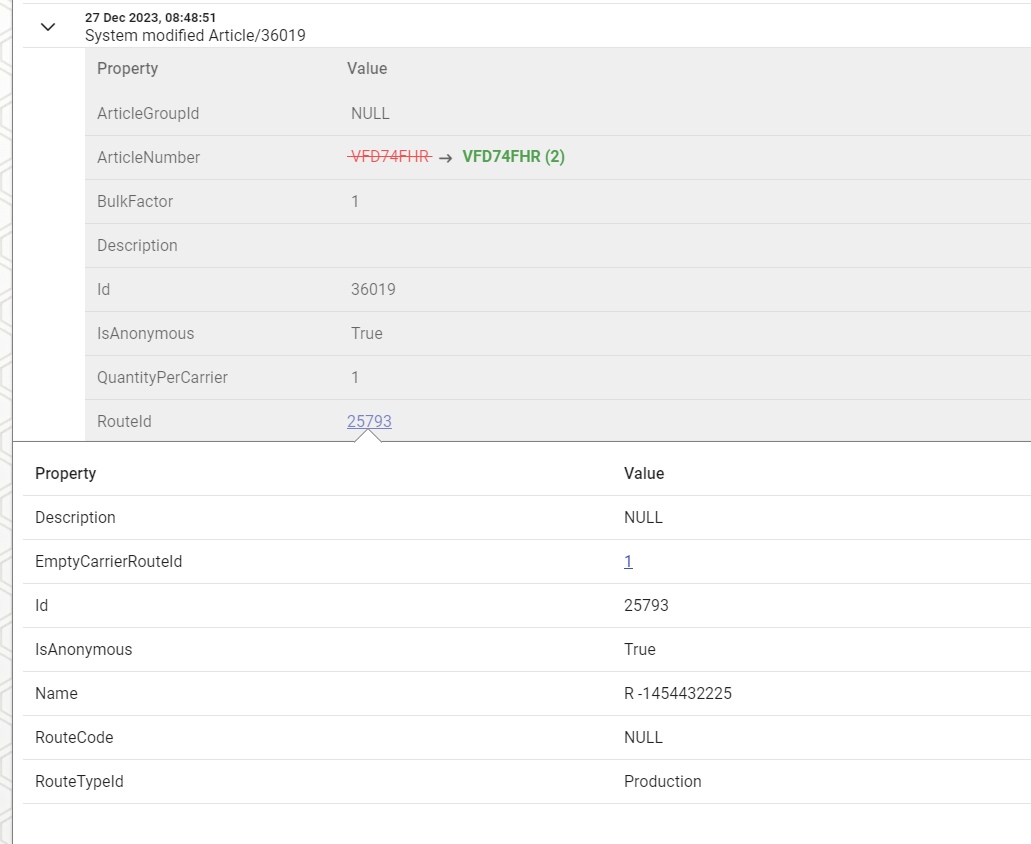
We can see who made the change and the id and name of the changed entity. If the changed was made automatically, or by an anonymous user, it will simply say "System" changed something.
When available, there will also be information about where the request originated from. This can be an IP address when the change was made in the UI, or a node and terminal when the change was made on a terminal.
The previous and new values are marked as red and green. Connected entities can be clicked to show a snapshot of that item at the point in time the change was made. These entities can be further navigated by clicking the blue links.