For general information on metrics see Topic: Metrics.
In the UI, navigate to Hardware > Metrics to view the metrics page.
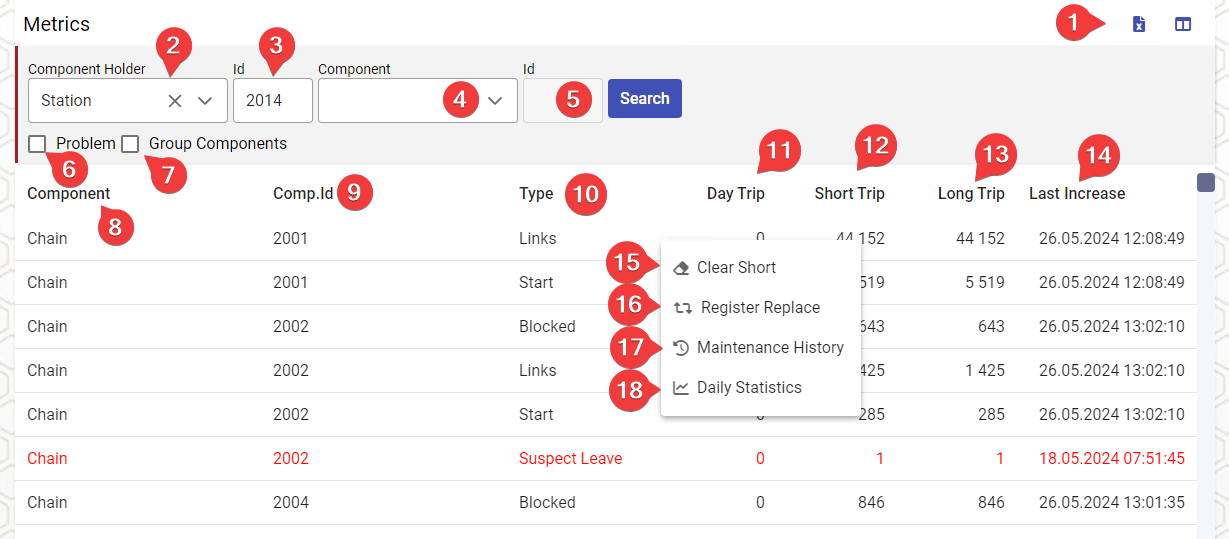
Filters & Display Options
| No | Description |
|---|---|
| 1 | Excel Export, Column Options |
| 2 | Filter metrics by Component Holder, such as components belonging to a station |
| 3 | Filter by id of the component holder (Station, Line, ICU etc) |
| 4 | Filter by component, options are different depending on choice in component holder dropdown |
| 5 | Filter by individual component id |
| 6 | Filter to show only problems, these are shown with red text in the grid. Once this is selected, there is an extra option to only show problems that have happened today. |
| 7 | Hide individual ids and instead get aggregated metrics per component. |
Grid Columns
Columns may be hidden or shown by using the column options button in the top right.
| No | Description |
|---|---|
| 8 | Column with name of component |
| 9 | Column with component id |
| 10 | Column containing the metric name |
| 11 | Column containing the day trip counter (number accumulated since midnight) |
| 12 | Column containing the short trip counter (number accumulated since last manual reset) |
| 13 | Column containing the long trip counter (number accumulated since part replacement) |
| 14 | Column containing the date when this counter last increased. |
Context Menu
The context menu can be shown by right clicking the row on a PC, or long press on mobile devices.
| No | Description |
|---|---|
| 15 | Trigger manual reset of short counter |
| 16 | Register a part replacement and reset the long trip counter |
| 17 | View the maintenance history of this part |
| 18 | Show this metric as a graph, with the value for each day |