General Report Controls
Run/Cancel button with integrated side-menu
Pressing the 'Run' button will start the underlying query to the history database. While it's running, it can be aborted by pressing the 'Cancel' button.
Export
The export buttons can be found on the integrated side-menu of the 'Run' button.
When a report has grouped data (an expand button on the left side) there will be two Export options:
First option "Export raw data", if available is for the (ungrouped data) option. This option will export each row unaggregated, including the content of each expanded row.
The second export option is called "Export" and will export the aggregated data, meaning what you see in the table is what will be exported.
Exports data to Excel (.xlsx) format with report name and date following the local format as follows:
[ReportName]_[Date-From]_[Date-To].xlsx
This operation might take longer than usual when querying longer timespans.
Interval Picker
Presets
The panel to the left consists of a list of presets where you can select a pre-defined interval.
Date-Time picker
The panel to the right is a Date-Time picker where you choose a Date and a Time for the start and end interval.
When shifts have been configured there'll be a 'Shifts' option in the preset menu with each corresponding shift time for the selected day
Report Settings
If the report has special settings that can be configured, there'll be a cogwheel-icon in the top right corner. The settings will be saved for each user.
Columns
Choose which columns should be shown in the report. Columns are unique and saved for each user.
Column widths can be adjusted by dragging the line between them.
Reports with Minutes
All reports displaying minutes are using decimal minutes. See below formulas for conversion between minutes and decimal minutes:
Minutes → Decimal Minutes

Example:
Time: 3 minutes and 45 seconds
Calculation:
3+(45/60)= 3.75
Result: 3 minutes and 45 seconds equals 3.75 decimal minutes.
Decimal minutes → Minutes
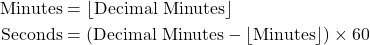
Example:
Time: 5.25 decimal minutes
Calculation:
Minutes = 5
Seconds = (5.25-5) = 0.25
5 + (0,25 * 60) = 5min 15 seconds
Result: 5.25 decimal minutes equals 5 min 15 seconds.
Charts
Most reports have the option to split the data by time (a specified interval) which in turn will generate multiple rows with a date and time for each entry. With this feature one can for instance see the trend of specified value over time. After running the report, press the "Chart"-tab, choose a column that you want to see, then choose the datakeys you want to compare between. The chart is available to export in the following formats: SVG, PNG and CSV.
Custom Reports
It's possible to make custom reports by publishing a Query. Any parameters to the report will be provided as inputs on the report page.